Solution-调试与性能分析
1. 调试
- 使用 Linux 上的
journalctl或 macOS 上的log show命令来获取最近一天中超级用户的登录信息及其所执行的指令。如果找不到相关信息,您可以执行一些无害的命令,例如sudo ls然后再次查看。 这里我在树莓派上查询相关日志pi@raspberrypi:~$ journalctl | grep sudo pi@raspberrypi:~$ sudo ls Bookshelf myconfig project proxy pi@raspberrypi:~$ journalctl | grep sudo May 16 03:06:04 raspberrypi sudo[799]: pi : TTY=pts/0 ; PWD=/home/pi ; USER=root ; COMMAND=/usr/bin/ls May 16 03:06:04 raspberrypi sudo[799]: pam_unix(sudo:session): session opened for user root by pi(uid=0) May 16 03:06:04 raspberrypi sudo[799]: pam_unix(sudo:session): session closed for user root pi@raspberrypi:~$在 Mac 上面使用下面的命令
log show --last 1h | grep sudo - 安装
shellcheck并尝试对下面的脚本进行检查。这段代码有什么问题吗?请修复相关问题。在您的编辑器中安装一个 linter 插件,这样它就可以自动地显示相关警告信息。#!/bin/sh ## Example: a typical script with several problems for f in $(ls *.m3u) do grep -qi hq.*mp3 $f \ && echo -e 'Playlist $f contains a HQ file in mp3 format' done在 Vim 中可以通过 neomake 插件来集成 shellcheck,在
~/.vimrc中添加 ` Plug ‘neomake/neomake’`call plug#begin() Plug 'neomake/neomake' call plug#end()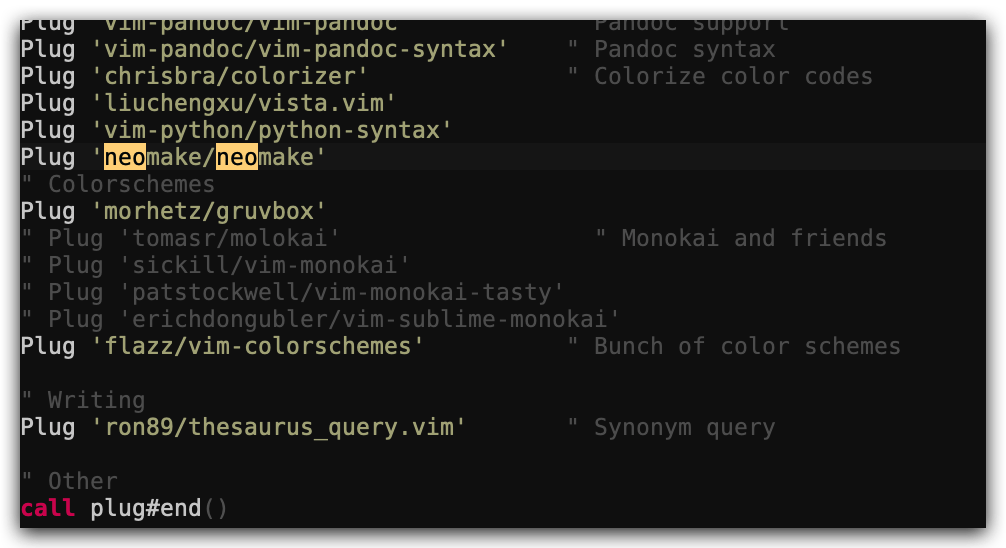 然后在 vim 执行
 :PlugInstall安装插件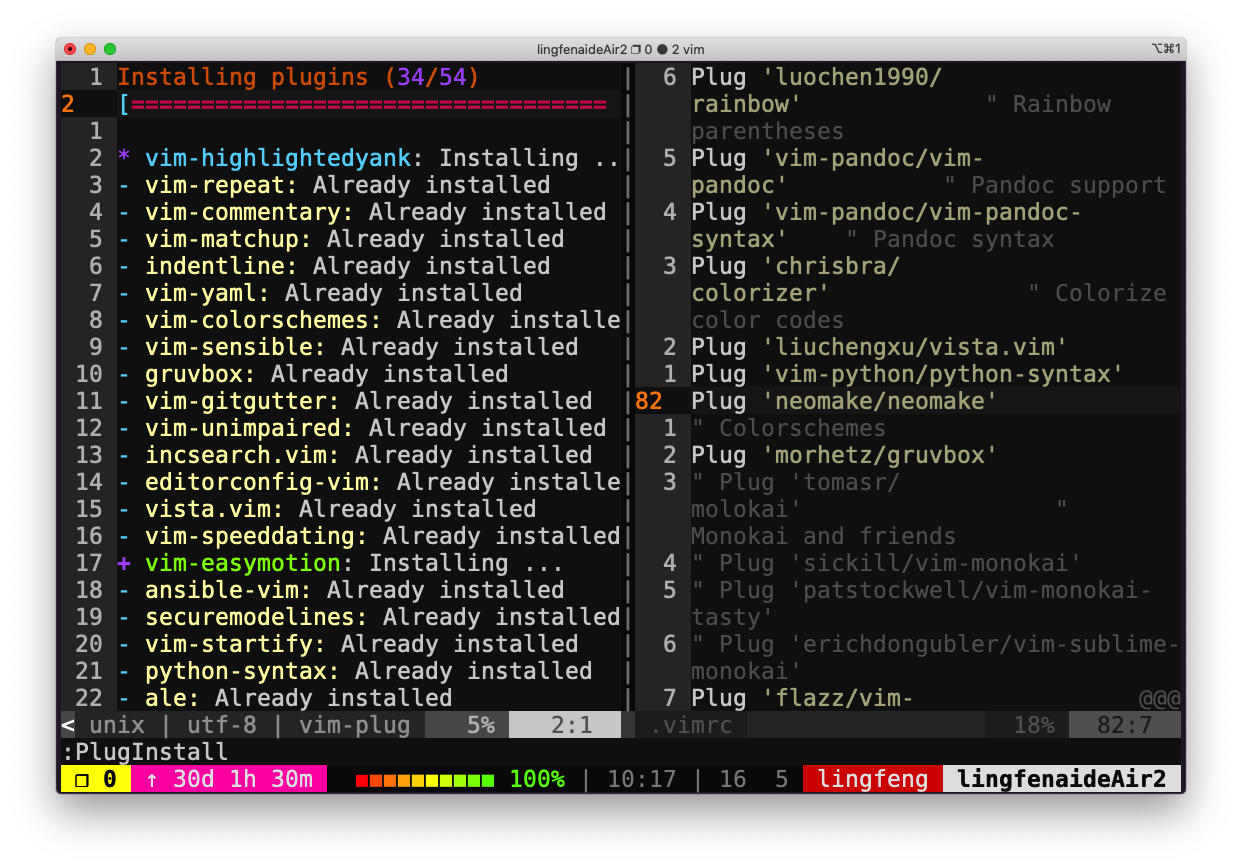 在需要检查的 shell 脚本中,执行
 :Neomake即可进行 shellcheck 检查。然后光标移动到对应行时可以看到告警或错误。
-
(进阶题) 请阅读 可逆调试 并尝试创建一个可以工作的例子(使用
rr或RevPDB)。此例主要参考了 debug-c-and-c++-programs-with-rr,使用的代码是 demo.c
 # perf内置在linux-tools中,使用rr需要先安装perf
 ~/debug $ sudo apt install linux-tools-common linux-tools-generic linux-tools-`uname -r`
 ~/debug $ sudo apt install rr
 ~/debug $ echo 1 | sudo tee /proc/sys/kernel/perf_event_paranoid
 ~/debug $ gcc -g demo.c -o demo
 ~/debug $ ./demo
 f(0)=0
 f(1)=0
 f(2)=0
 f(3)=0
 # 预期输出结果为[0, 2, 4, 6]
# -n选项:输出./demo的运行结果 ~/debug $ sudo rr record -n ./demo rr: Saving execution to trace directory `/root/.local/share/rr/deom-1'. f(0)=0 f(1)=0 f(2)=0 f(3)=0 # 进入rr-debugger中调试代码 ~/debug $ sudo rr replay- 在 demo.c 中,print_array 只是打印出 stru.a 数组的内容,所以出错的地方应该在打印之前,即可能是 multiply 函数的调用,在此设置断点。
(rr) b multiply # break简写为b Breakpoint 1 at 0x5568214c818c: file demorr.c, line 16. (rr) c # continue简写为c Continuing. Breakpoint 1, multiply (a=0x5568214cb018 <stru> "", size=4, num=0) at demorr.c:16 16 for (i=0; i<size; i++)- 注意到 multiply 中传入 num 的值为 0, 正常应该是 stru.num 的初始值 2,使用 watch 来查看 stru.num 的值什么时候被改变的。
(rr) watch -l stru.num Hardware watchpoint 2: -location stru.num # reverse-continue简写为rc,回退到watchpoint的值被更改的地方 (rr) rc Continuing. Hardware watchpoint 2: -location stru.num # stru.num的值从 2 变为了 0(注意现在是使用rc反向调试) # stru.num的值的变更发生在initialize函数的调用中 Old value = 0 New value = 2 initialize (a=0x5568214cb018 <stru> "", size=3) at demorr.c:10 10 a[size--] = 0; (rr) q- 观察 initialize 函数中的语句,发现
size--先返回size值,再执行size=size-1的操作。而且,由于结构体中变量的内存空间是连续的,所以执行a[SIZE]=0时,把stru.num的值置为了 0。为此,将a[size--]=0修改为a[--size]=0,再观察输出结果。
 ~/debug $ vim demo.c
 ~/debug $ gcc -g demo.c -o demo
 ~/debug $ ./demo
 f(0)=0
 f(1)=2
 f(2)=4
 f(3)=6
2. 性能分析
-
这里 有一些排序算法的实现。请使用
cProfile和line_profiler来比较插入排序和快速排序的性能。两种算法的瓶颈分别在哪里?然后使用memory_profiler来检查内存消耗,为什么插入排序更好一些?然后再看看原地排序版本的快排。附加题:使用perf来查看不同算法的循环次数及缓存命中及丢失情况。python -m cProfile -s time sorts.py #按照执行时间排序python -m cProfile -s time sorts.py | grep sorts.py 33748/1000 0.066 0.000 0.069 0.000 sorts.py:23(quicksort) 34356/1000 0.045 0.000 0.055 0.000 sorts.py:32(quicksort_inplace) 3 0.037 0.012 0.347 0.116 sorts.py:4(test_sorted) 1000 0.031 0.000 0.032 0.000 sorts.py:11(insertionsort) 1 0.007 0.007 0.385 0.385 sorts.py:1(<module>)使用
line_profiler进行分析,需要安装:pip install line_profiler然后为需要分析的函数添加装饰器
@profile,并执行:kernprof -l -v sorts.py首先对快速排序进行分析:
 Wrote profile results to sorts.py.lprof
 Timer unit: 1e-06 s

 Total time: 0.490021 s
 File: sorts.py
 Function: quicksort at line 22

 Line #      Hits         Time  Per Hit   % Time  Line Contents
 ==============================================================
     22                                           @profile
     23                                           def quicksort(array):
     24     32594      91770.0      2.8     18.7      if len(array) <= 1:
     25     16797      36674.0      2.2      7.5          return array
     26     15797      37626.0      2.4      7.7      pivot = array[0]
     27     15797     125796.0      8.0     25.7      left = [i for i in array[1:] if i < pivot]
     28     15797     119954.0      7.6     24.5      right = [i for i in array[1:] if i >= pivot]
     29     15797      78201.0      5.0     16.0      return quicksort(left) + [pivot] + quicksort(right)
然后对插入排序进行分析:
 Total time: 1.33387 s
 File: sorts.py
 Function: insertionsort at line 11

 Line #      Hits         Time  Per Hit   % Time  Line Contents
 ==============================================================
     11                                           @profile
     12                                           def insertionsort(array):
     13
     14     26801      44242.0      1.7      3.3      for i in range(len(array)):
     15     25801      43372.0      1.7      3.3          j = i-1
     16     25801      41950.0      1.6      3.1          v = array[i]
     17    234763     434280.0      1.8     32.6          while j >= 0 and v < array[j]:
     18    208962     380062.0      1.8     28.5              array[j+1] = array[j]
     19    208962     343217.0      1.6     25.7              j -= 1
     20     25801      45248.0      1.8      3.4          array[j+1] = v
     21      1000       1503.0      1.5      0.1      return array
插入排序的耗时更高一些。快速排序的瓶颈在于
left和right的赋值,而插入排序的瓶颈在while循环。
使用memory_profiler进行分析,需要安装:pip install memory_profiler同样需要添加
@profile装饰器。 首先分析快速排序的内存使用情况:pi@raspberrypi:~$ python -m memory_profiler sorts.py Filename: sorts.py Line # Mem usage Increment Occurences Line Contents ============================================================ 22 20.199 MiB 20.199 MiB 32800 @profile 23 def quicksort(array): 24 20.199 MiB 0.000 MiB 32800 if len(array) <= 1: 25 20.199 MiB 0.000 MiB 16900 return array 26 20.199 MiB 0.000 MiB 15900 pivot = array[0] 27 20.199 MiB 0.000 MiB 152906 left = [i for i in array[1:] if i < pivot] 28 20.199 MiB 0.000 MiB 152906 right = [i for i in array[1:] if i >= pivot] 29 20.199 MiB 0.000 MiB 15900 return quicksort(left) + [pivot] + quicksort(right)然后分析插入排序的内存使用情况:
 pi@raspberrypi:~$ python -m memory_profiler sorts.py

 Filename: sorts.py

 Line #    Mem usage    Increment  Occurences   Line Contents
 ============================================================
     11   20.234 MiB   20.234 MiB        1000   @profile
     12                                         def insertionsort(array):
     13
     14   20.234 MiB    0.000 MiB       26638       for i in range(len(array)):
     15   20.234 MiB    0.000 MiB       25638           j = i-1
     16   20.234 MiB    0.000 MiB       25638           v = array[i]
     17   20.234 MiB    0.000 MiB      237880           while j >= 0 and v < array[j]:
     18   20.234 MiB    0.000 MiB      212242               array[j+1] = array[j]
     19   20.234 MiB    0.000 MiB      212242               j -= 1
     20   20.234 MiB    0.000 MiB       25638           array[j+1] = v
     21   20.234 MiB    0.000 MiB        1000       return array
同时对比原地操作的快速排序算法内存情况:
pi@raspberrypi:~$ python -m memory_profiler sorts.py Filename: sorts.py Line # Mem usage Increment Occurences Line Contents ============================================================ 31 20.121 MiB 20.121 MiB 33528 @profile 32 def quicksort_inplace(array, low=0, high=None): 33 20.121 MiB 0.000 MiB 33528 if len(array) <= 1: 34 20.121 MiB 0.000 MiB 42 return array 35 20.121 MiB 0.000 MiB 33486 if high is None: 36 20.121 MiB 0.000 MiB 958 high = len(array)-1 37 20.121 MiB 0.000 MiB 33486 if low >= high: 38 20.121 MiB 0.000 MiB 17222 return array 39 40 20.121 MiB 0.000 MiB 16264 pivot = array[high] 41 20.121 MiB 0.000 MiB 16264 j = low-1 42 20.121 MiB 0.000 MiB 124456 for i in range(low, high): 43 20.121 MiB 0.000 MiB 108192 if array[i] <= pivot: 44 20.121 MiB 0.000 MiB 55938 j += 1 45 20.121 MiB 0.000 MiB 55938 array[i], array[j] = array[j], array[i] 46 20.121 MiB 0.000 MiB 16264 array[high], array[j+1] = array[j+1], array[high] 47 20.121 MiB 0.000 MiB 16264 quicksort_inplace(array, low, j) 48 20.121 MiB 0.000 MiB 16264 quicksort_inplace(array, j+2, high) 49 20.121 MiB 0.000 MiB 16264 return array- 遗憾的是,按照上面的方法使用
memory_profiler给出的结果无法作为这三种排序算法内存消耗对比的依据(从我自己运行的结果来看,insertionsort 的 43.301MiB 甚至还大于 quicksort 的 43.195MiB,与预期结果相反!!) - 另外,观察三组结果中,函数的每一行的
Increment(即执行该行所导致的内存占用的增减变化)均为 0!这是由于 test_sorted 用于测试的 list 太小了,长度仅为 1~50,导致排序算法中每一行创建的变量内存占用也很小。如果直接使用一个长度为 2000 的 list 来测试:l = [random.randint(0,10000) for i in range(0, 2000)],会发现 quicksort 函数的Left或Right行的Increment数据不为 0(创建的 list 占用内存较大了)。与此同时,用该 list 测试 insertionsort 函数时,发现耗用时间较长。 - 参考 python-profiling-memory-profiling 这篇文章,使用一个长度为 10 000 的 list 测试冒泡排序的内存消耗,需要将近 30 分钟才输出结果。(使用 memory_profiler 要权衡时间与效率)
使用 perf 检查每个算法的循环次数、缓存命中和丢失:
- insertionsort 的结果
~/debug $ vim sorts.py # 修改main函数删除for循环,改为:test_sorted(insertionsort) ~/debug $ sudo perf stat -e cycles,cache-references,cache-misses python3 sorts.py Performance counter stats for 'python3 sorts.py': 187,253,954 cycles 5,023,695 cache-references 891,768 cache-misses # 17.751 % of all cache refs 0.099464106 seconds time elapsed 0.082930000 seconds user 0.016586000 seconds sys- quicksort 的结果
~/debug $ vim sorts.py # main函数的内容改为:test_sorted(quicksort) ~/debug $ sudo perf stat -e cycles,cache-references,cache-misses python3 sorts.py Performance counter stats for 'python3 sorts.py': 192,741,421 cycles 6,843,630 cache-references 898,594 cache-misses # 13.130 % of all cache refs 0.057831555 seconds time elapsed 0.057863000 seconds user 0.000000000 seconds sys- quicksort_inplace 的结果
~/debug $ vim sorts.py # main函数改为:test_sorted(quicksort_inplace) ~/debug $ sudo perf stat -e cycles,cache-references,cache-misses python3 sorts.py Performance counter stats for 'python3 sorts.py': 179,221,185 cycles 5,700,092 cache-references 892,157 cache-misses # 15.652 % of all cache refs 0.097429528 seconds time elapsed 0.089351000 seconds user 0.008122000 seconds sys - 遗憾的是,按照上面的方法使用
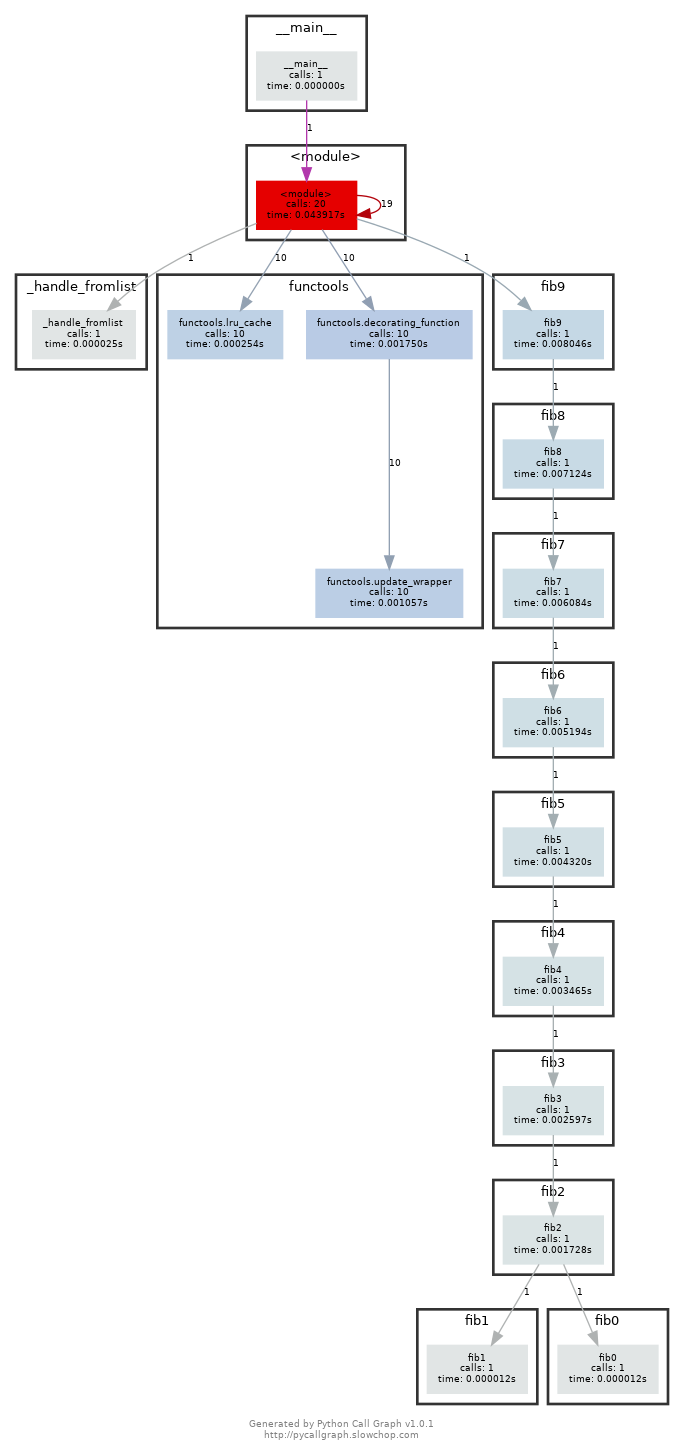
- 这里有一些用于计算斐波那契数列 Python 代码,它为计算每个数字都定义了一个函数:
#!/usr/bin/env python
def fib0(): return 0

def fib1(): return 1

s = """def fib{}(): return fib{}() + fib{}()"""

if __name__ == '__main__':

    for n in range(2, 10):
        exec(s.format(n, n-1, n-2))
    # from functools import lru_cache
    # for n in range(10):
    #     exec("fib{} = lru_cache(1)(fib{})".format(n, n))
    print(eval("fib9()"))
将代码拷贝到文件中使其变为一个可执行的程序。首先安装
pycallgraph和graphviz(如果您能够执行dot, 则说明已经安装了 GraphViz.)。并使用pycallgraph graphviz -- ./fib.py来执行代码并查看pycallgraph.png这个文件。fib0被调用了多少次?我们可以通过记忆法来对其进行优化。将注释掉的部分放开,然后重新生成图片。这回每个fibN函数被调用了多少次?setuptools 版本过高可能导致 pycallgraph 安装失败
pip install "setuptools<58.0.0" pip install pycallgraph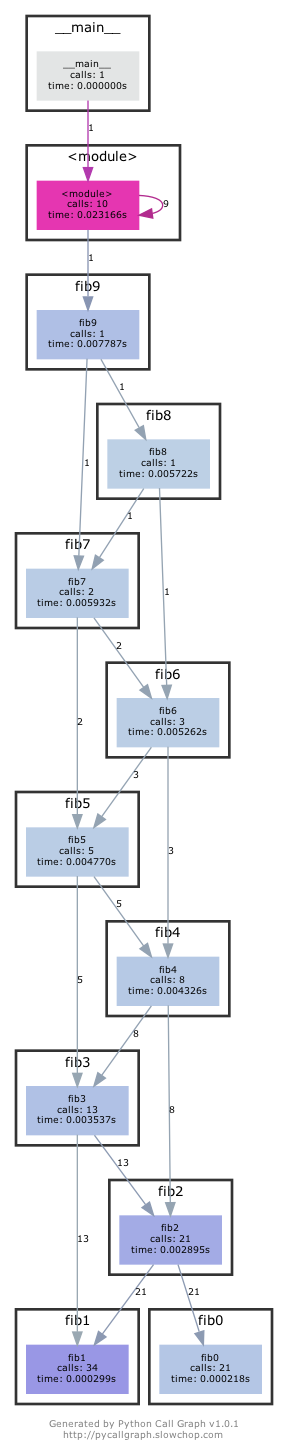 放开注释内容后,再次执行:
 注意:如果你是 Python 2.7 的话,需要修改一下注释的内容:
from backports.functools_lru_cache import lru_cache不过生成的图片里面会包含很多不相关的内容。
-
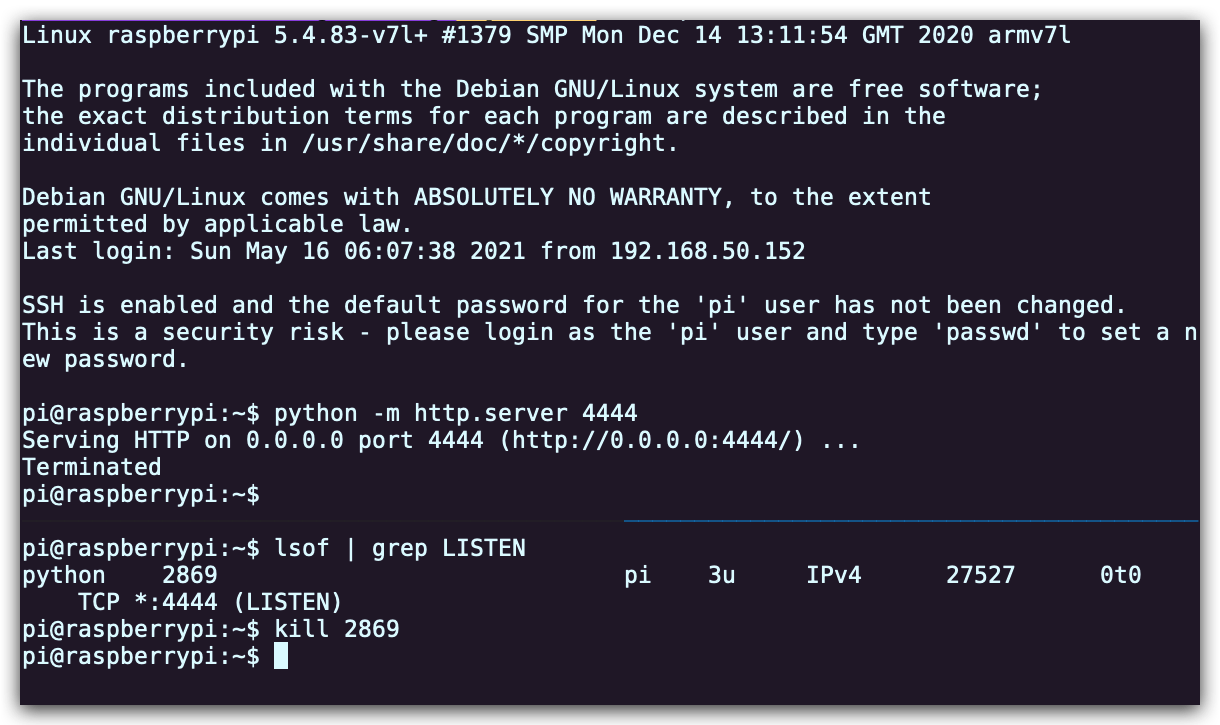
我们经常会遇到的情况是某个我们希望去监听的端口已经被其他进程占用了。让我们通过进程的 PID 查找相应的进程。首先执行
python -m http.server 4444启动一个最简单的 web 服务器来监听4444端口。在另外一个终端中,执行lsof | grep LISTEN打印出所有监听端口的进程及相应的端口。找到对应的 PID 然后使用kill <PID>停止该进程。
- 限制进程资源也是一个非常有用的技术。执行
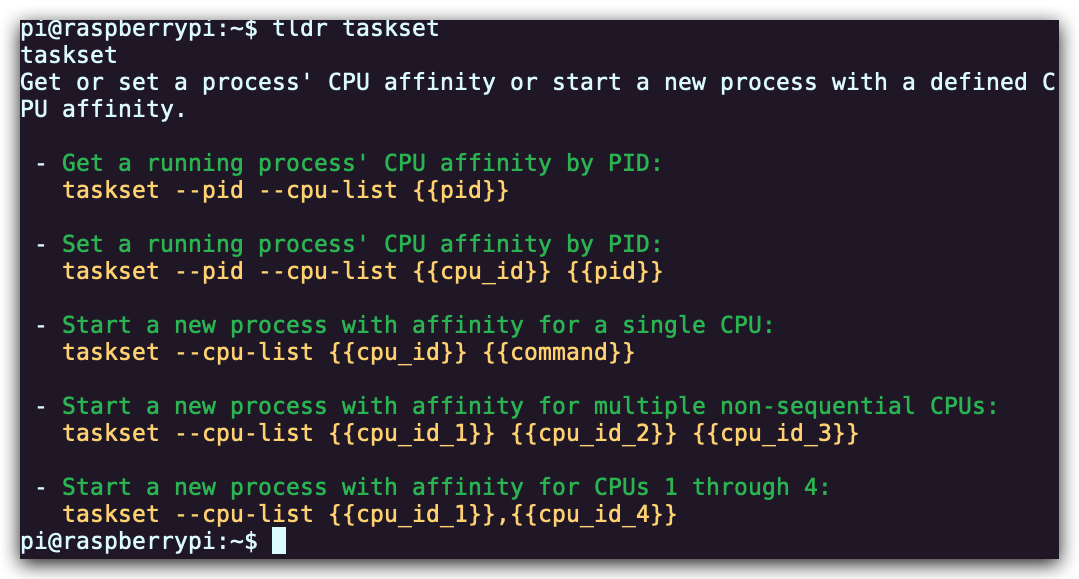
stress -c 3并使用htop对 CPU 消耗进行可视化。现在,执行taskset --cpu-list 0,2 stress -c 3并可视化。stress占用了 3 个 CPU 吗?为什么没有?阅读man taskset来寻找答案。附加题:使用cgroups来实现相同的操作,限制stress -m的内存使用。
首先是设备正常运行状态下的资源占用情况: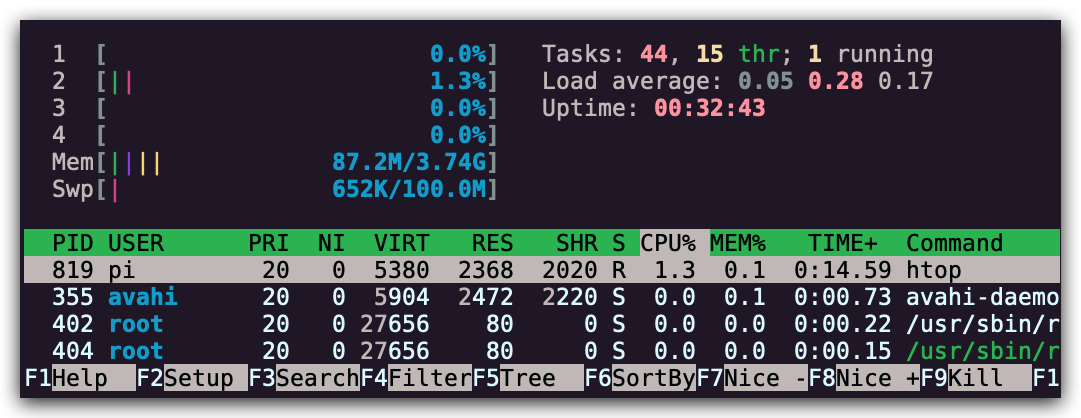 创建负载:
创建负载:
stress -c 3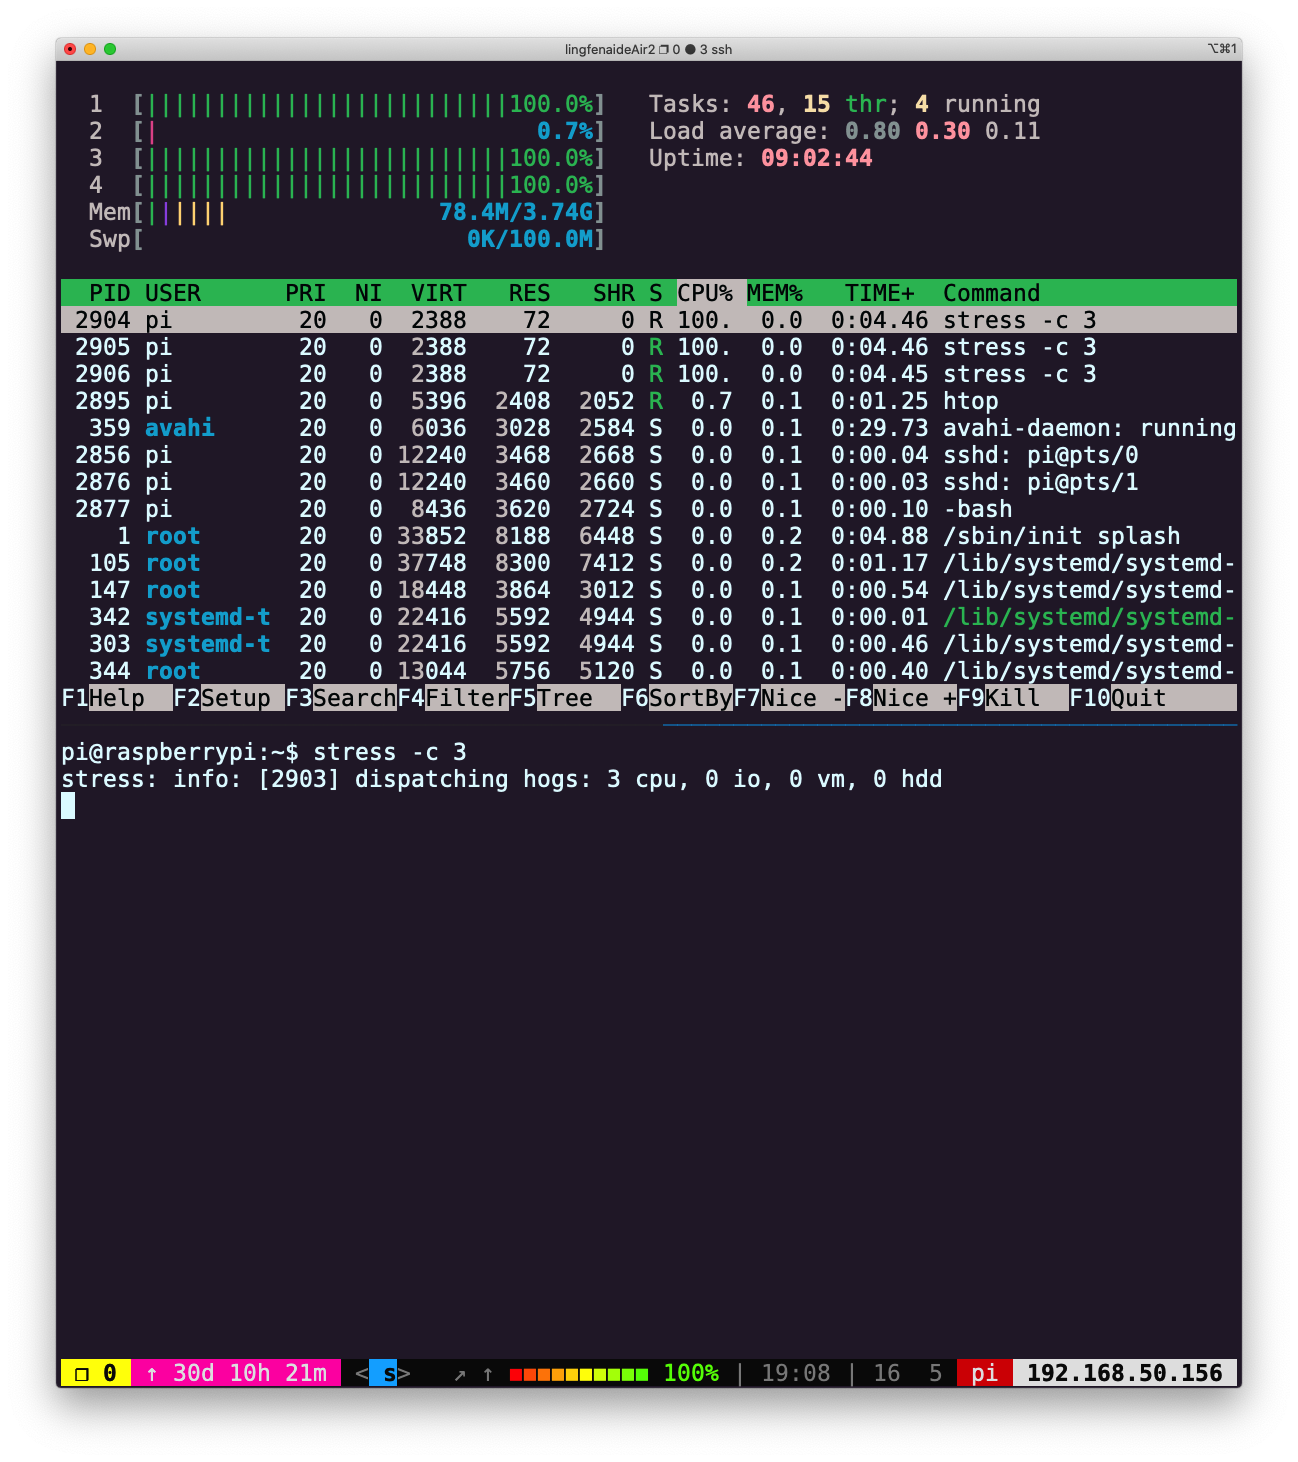 限制资源消耗
taskset --cpu-list 0,2 stress -c 3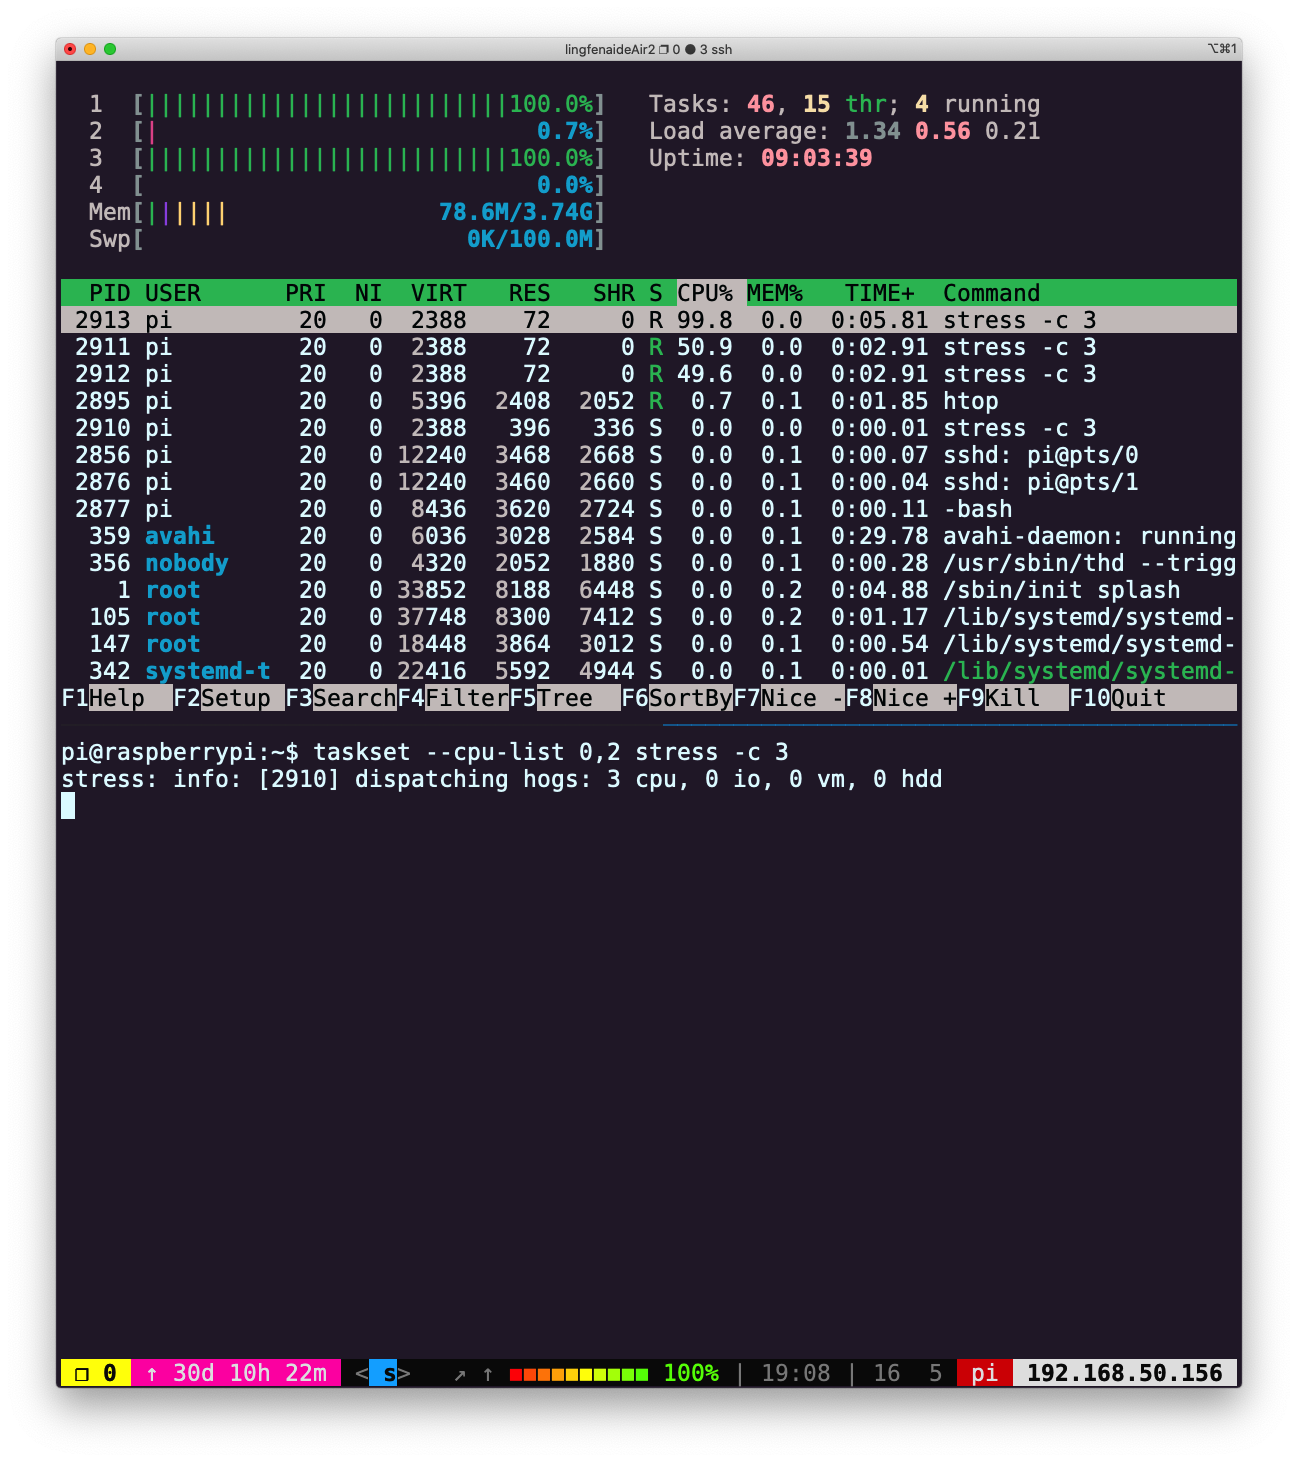 taskset 命令可以将任务绑定到指定 CPU 核心。
 接下来看
接下来看 cgroups是如何工作的,我参考了两篇文章:首先我们看一下如何创建内存负载,这里创建 3 个 worker 来不停的申请释放 512M 内存:
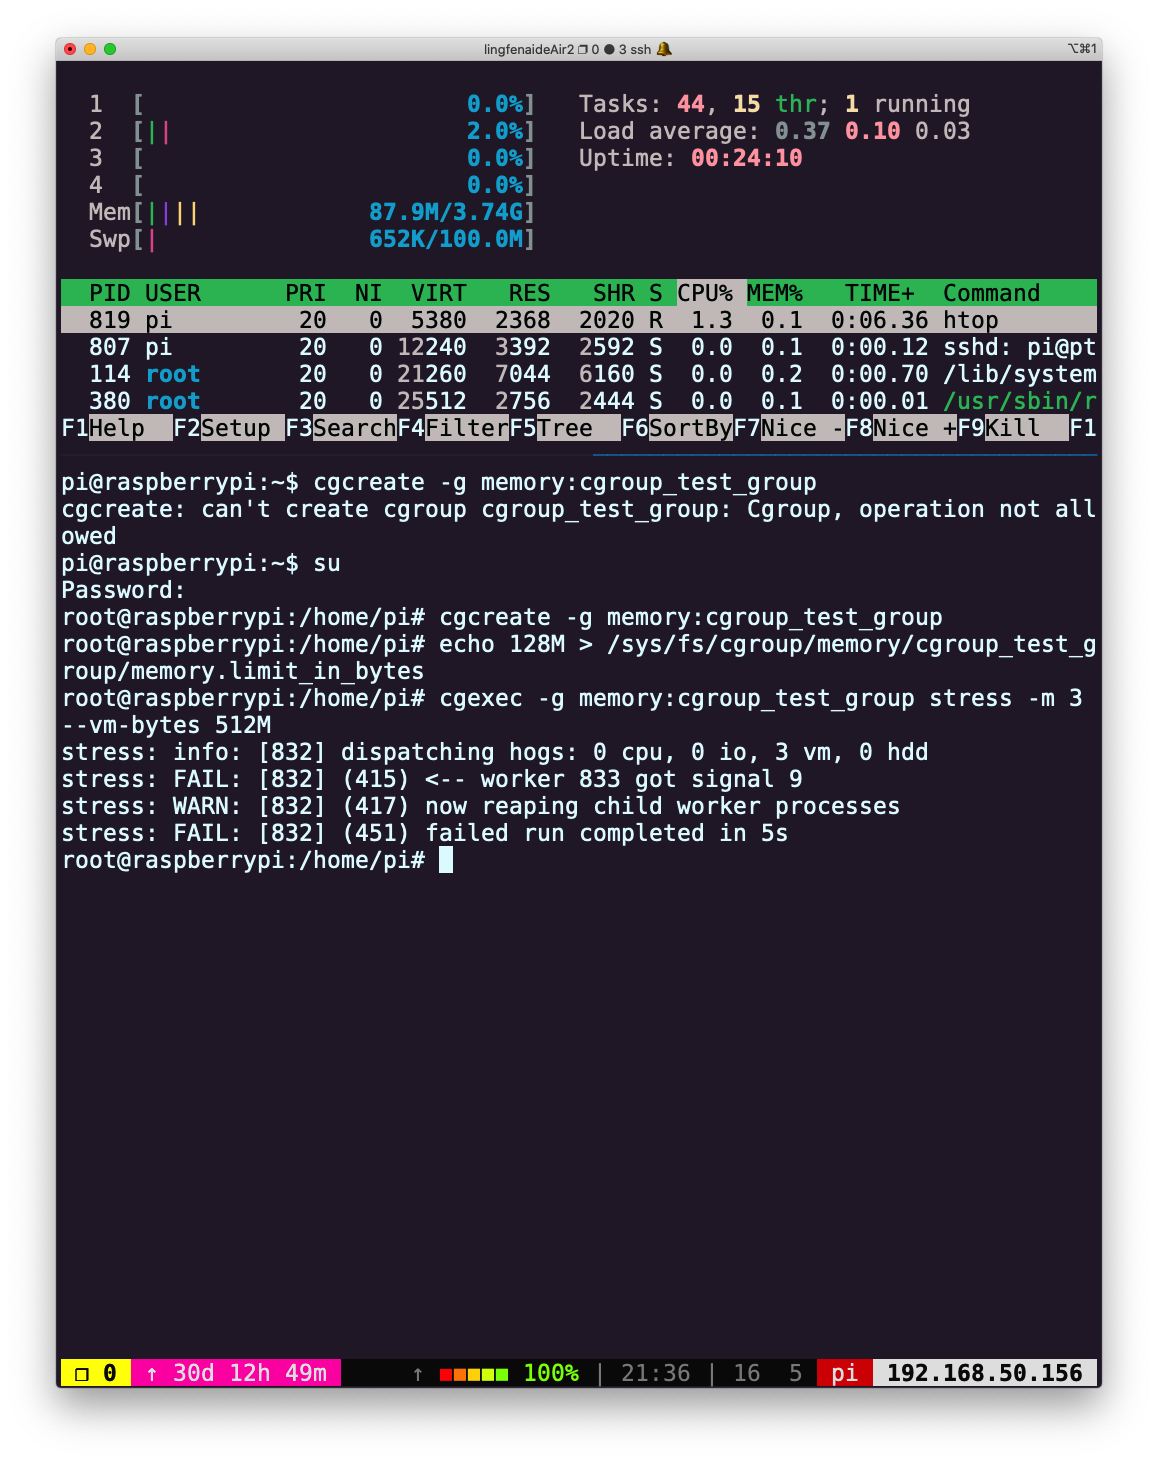
stress -m 3 --vm-bytes 512M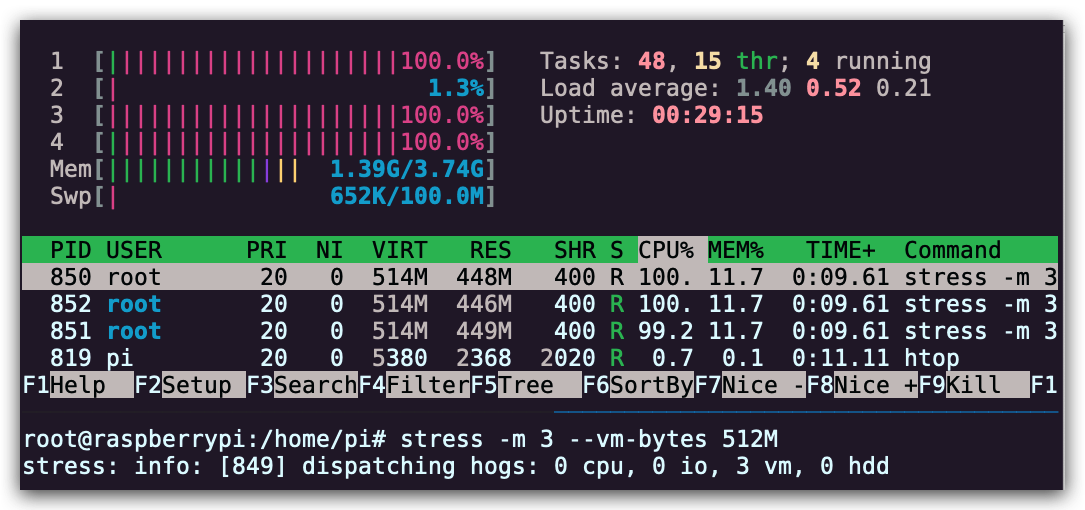 由于题目要求限制内存的使用,首先我们看一下内存设备是否已经挂载:
 root@raspberrypi:~# lssubsys -am
 memory
 cpuset /sys/fs/cgroup/cpuset
 cpu,cpuacct /sys/fs/cgroup/cpu,cpuacct
 blkio /sys/fs/cgroup/blkio
 devices /sys/fs/cgroup/devices
 freezer /sys/fs/cgroup/freezer
 net_cls,net_prio /sys/fs/cgroup/net_cls,net_prio
 perf_event /sys/fs/cgroup/perf_event
 pids /sys/fs/cgroup/pids
 root@raspberrypi:~#
内存没挂载的情况下,需要手动挂载:
mount -t cgroup -o memory memory /sys/fs/cgroup/memory我在树莓派上出现了不能挂载的情况,此时需要修改
boot.cmdline.txt,添加:cgroup_enable=memory cgroup_memory=1然后重启,再次查看
 pi@raspberrypi:~$ lssubsys -am
 cpuset /sys/fs/cgroup/cpuset
 cpu,cpuacct /sys/fs/cgroup/cpu,cpuacct
 blkio /sys/fs/cgroup/blkio
 memory /sys/fs/cgroup/memory
 devices /sys/fs/cgroup/devices
 freezer /sys/fs/cgroup/freezer
 net_cls,net_prio /sys/fs/cgroup/net_cls,net_prio
 perf_event /sys/fs/cgroup/perf_event
 pids /sys/fs/cgroup/pids
 pi@raspberrypi:~$
已经挂载成功,然后创建组并写入规则(内存限制为 128M)
 root@raspberrypi:/home/pi# cgcreate -g memory:cgroup_test_group
 root@raspberrypi:/home/pi# echo 128M > /sys/fs/cgroup/memory/cgroup_test_group/memory.limit_in_bytes
然后在控制组中运行
stress,创建 3 个 worker 申请 512M 内存:oot@raspberrypi:/home/pi# cgexec -g memory:cgroup_test_group stress -m 3 --vm-bytes 512M stress: info: [832] dispatching hogs: 0 cpu, 0 io, 3 vm, 0 hdd stress: FAIL: [832] (415) <-- worker 833 got signal 9 stress: WARN: [832] (417) now reaping child worker processes stress: FAIL: [832] (451) failed run completed in 5s执行失败。
如果是申请 1M 内存,则可以成功运行:cgexec -g memory:cgroup_test_group stress -m 3 --vm-bytes 1M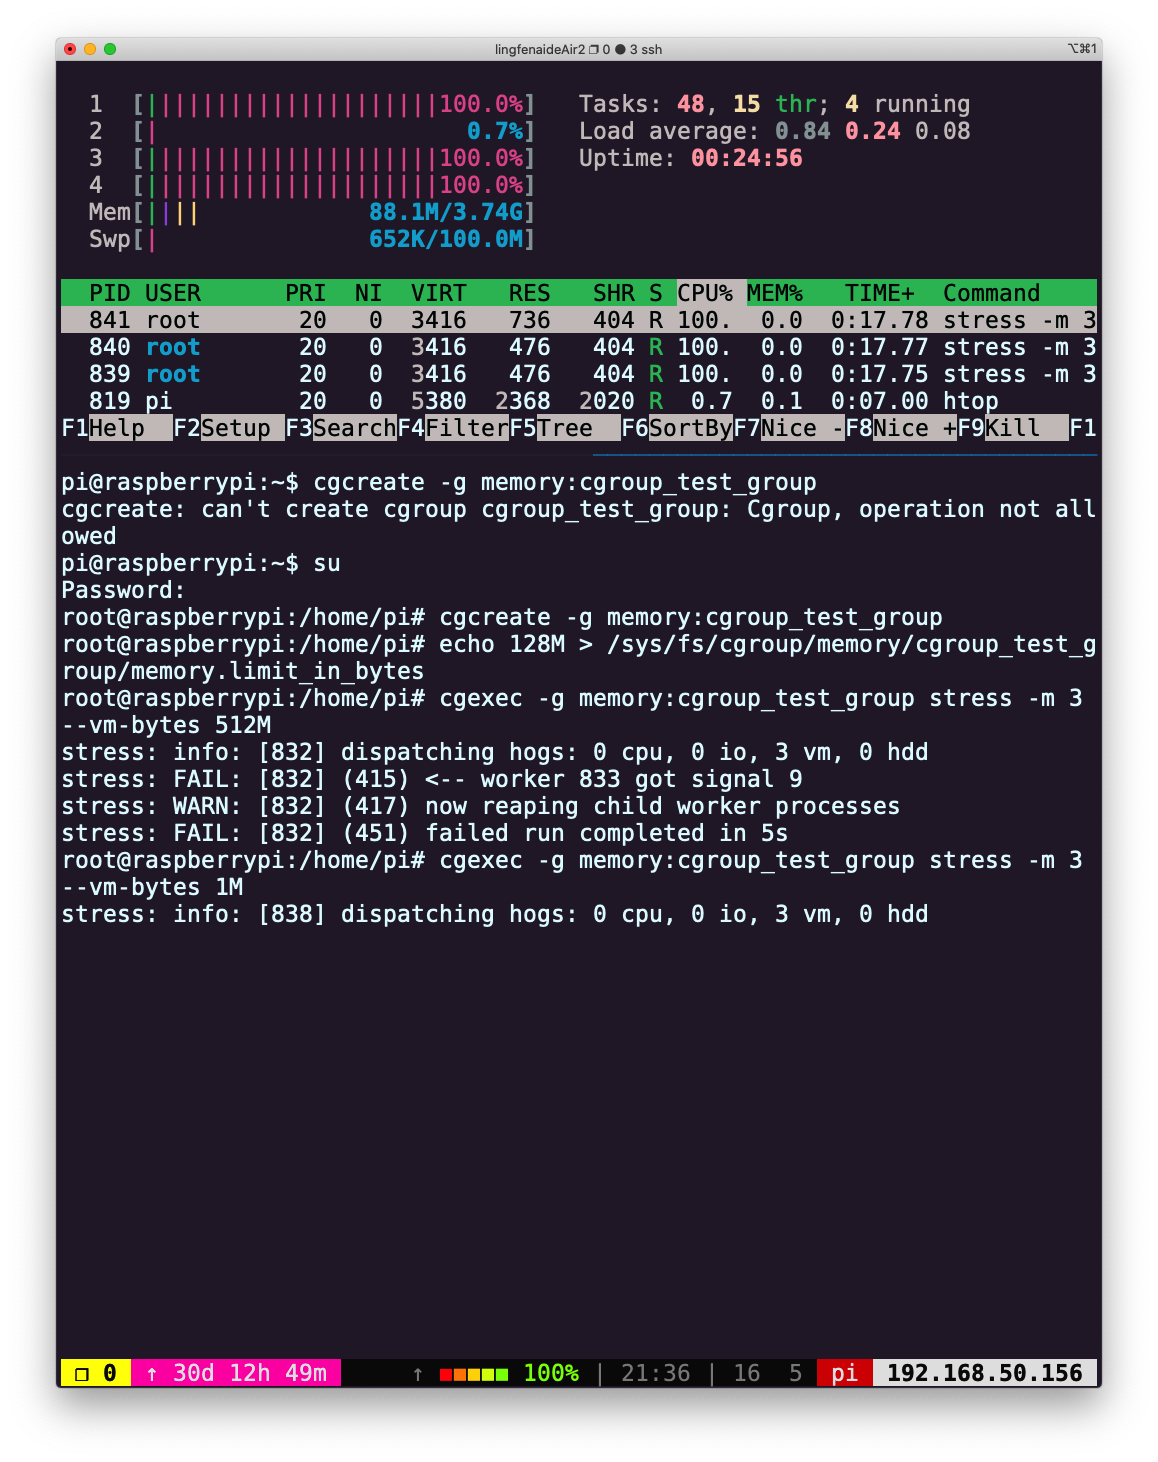
下面是使用 cgroupV2 限制 stress 命令内存的示例:比较新版本的 Ubuntu 默认安装
cgroup v2,可以参考 Ubuntu 激活 cgroupv2。下面,将使用 cgroupv2 实现限制进程内存消耗的操作,更多信息可参考 详解 CgroupV2。设置,使用 cgroup2
 ~ $ grep cgroup /proc/filesystems
 nodev   cgroup
 nodev   cgroup2
  # 输出结果有cgroup2,说明当前系统支持cgroup2
 ~ $ sudo vim /etc/default/grub
  # 查找变量GRUB_CMDLINE_LINUX_DEFAULT,将原来的行注释掉
  # 新增一行:GRUB_CMDLINE_LINUX_DEFAULT="systemd.unified_cgroup_hierarchy=1"
 ~ $ sudo update-grub
 ~ $ reboot
重启后,检查:
 ~ $ cat /sys/fs/cgroup/cgroup.controllers
 cpuset cpu io memory hugetlb pids rdma misc
  # 这些是cgroup挂载的控制器
 ~ $ sudo su
 root@laihj:~# cd /sys/fs/cgroup
  # 该目录为cgroup的根root,在其下创建的子目录是其节点
 root@laihj:/sys/fs/cgroup# mkdir -p test test/cg
 root@laihj:/sys/fs/cgroup# ls test
 cg                     cgroup.type          memory.numa_stat
 cgroup.controllers      cpu.pressure         memory.oom.group
 cgroup.events           cpu.stat             memory.pressure
 cgroup.freeze           io.pressure          memory.stat
 cgroup.kill             memory.current       memory.swap.current
 cgroup.max.depth        memory.events        memory.swap.events
 cgroup.max.descendants  memory.events.local  memory.swap.high
 cgroup.procs            memory.high          memory.swap.max
 cgroup.stat             memory.low           pids.current
 cgroup.subtree_control  memory.max           pids.events
 cgroup.threads          memory.min           pids.max
 root@laihj:/sys/fs/cgroup# ls test/cg
 cgroup.controllers  cgroup.max.descendants  cgroup.type
 cgroup.events       cgroup.procs            cpu.pressure
 cgroup.freeze       cgroup.stat             cpu.stat
 cgroup.kill         cgroup.subtree_control  io.pressure
 cgroup.max.depth    cgroup.threads          memory.pressure
  # test节点挂载了memory控制器,所以目录下出现了"memory.*"文件
为 test/cg 挂载 memory 控制器,并设置 memory 的使用大小
 root@laihj:/sys/fs/cgroup# cd test
 root@laihj:/sys/fs/cgroup/test# cat cgroup.subtree_control
 root@laihj:/sys/fs/cgroup/test# echo "+memory" > cgroup.subtree_control
 root@laihj:/sys/fs/cgroup/test# cat cgroup.subtree_control
 memory
 root@laihj:/sys/fs/cgroup/test# echo 100M > memory.max
 root@laihj:/sys/fs/cgroup/test# echo 0 > memory.swap.max
  # 设置memory的最大使用量为 100M,同时,必须限制内存交换空间的使用
将当前的
bash session pid写入 cg 中,接下来在 bash 中执行的所有命令会受到刚才的 memory 设置的影响(注意,除了根,进程只能驻留在叶节点(没有子 cgroup 目录的 cgroup 目录echo $$ > test/cgroup.procs会报错))root@laihj:/sys/fs/cgroup/test# echo $$ > cg/cgroup.procs root@laihj:/sys/fs/cgroup/test# stress -m 3 --vm-bytes 200M stress: info: [5018] dispatching hogs: 0 cpu, 0 io, 3 vm, 0 hdd stress: FAIL: [5018] (416) <-- worker 5020 got signal 9 stress: WARN: [5018] (418) now reaping child worker processes stress: FAIL: [5018] (452) failed run completed in 0s root@laihj:/sys/fs/cgroup/test# stress -m 3 --vm-bytes 40M # 3 个 worker 各分配 40M,总的 120M,仍超过了设置的100M上限 stress: info: [5030] dispatching hogs: 0 cpu, 0 io, 3 vm, 0 hdd stress: FAIL: [5030] (416) <-- worker 5032 got signal 9 stress: WARN: [5030] (418) now reaping child worker processes stress: FAIL: [5030] (452) failed run completed in 0s root@laihj:/sys/fs/cgroup/test# stress -m 3 --vm-bytes 20M stress: info: [5034] dispatching hogs: 0 cpu, 0 io, 3 vm, 0 hdd ^C # 正常执行,按下ctrl+C终止stress命令删除 cgroup 下的节点,需要从叶节点开始(最内层的目录)
# 确保test/cg中的进程全部停止,这里需要退出当前bash session,即关闭终端,然后,重新开启 ~ $ sudo rmdir /sys/fs/cgroup/test/cg ~ $ sudo rmdir /sys/fs/cgroup/test - (进阶题)
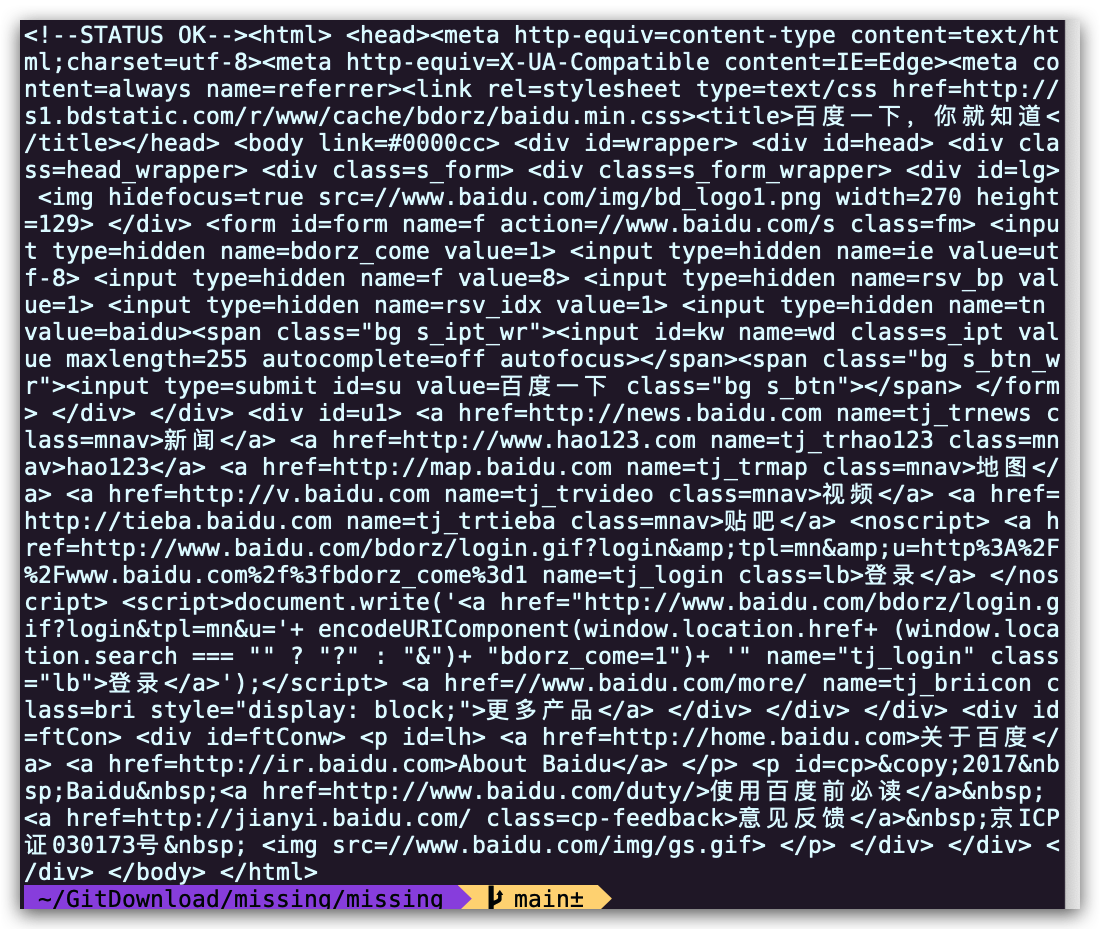
curl ipinfo.io命令或执行 HTTP 请求并获取关于您 IP 的信息。打开 Wireshark 并抓取curl发起的请求和收到的回复报文。(提示:可以使用http进行过滤,只显示 HTTP 报文) 这里我使用的是curl www.baidu.com,请求百度的首页并过滤了除 HTTP 之外的其他报文: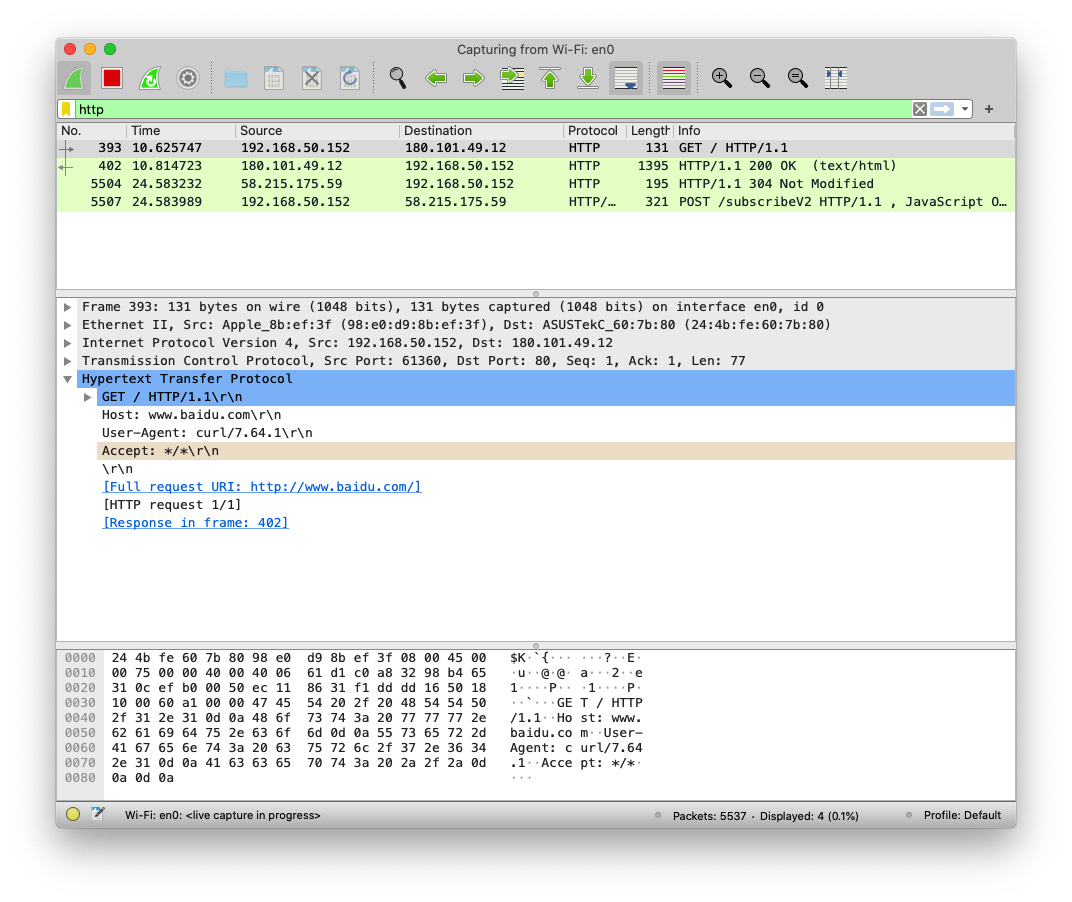
Licensed under CC BY-NC-SA.